This powerful reporting tool provides a platform for the analysing and visualising of data through the creation of visual stunning interactive reports and immersive dashboards. All of which can be published to the Power BI Service (in the cloud), refreshing with near-real-time data and providing all-the-time-on instant access to all the intended users of the reports, across numerous devices.
WHY IS POWER BI BECOMING SO POPULAR?
Well, the self-service nature of Power BI has put Business Intelligence Capabilities firmly in the hands of the user! Whilst in the past Business Intelligence software was an expensive business, many features of the Power BI platform have been made widely available to business users through existing Microsoft Office licencing packages. With both free and paid services offered by Microsoft. (To get started why not go and download Power BI Desktop for free from Microsoft’s Download Center!)
The tool itself is relatively intuitive and easy to use. Casual users can navigate the online Power BI Service offerings to interact/consume/share dashboards reports. More technical end users are required to create, maintain and publish reports using the Power BI Desktop app interface. Whilst in the past a lot of this work to create/maintain/publish would have fallen on dedicated trained teams and IT staff to manage such BI software solutions; there is now a far less of a reliance for the more technical expertise of IT power users.
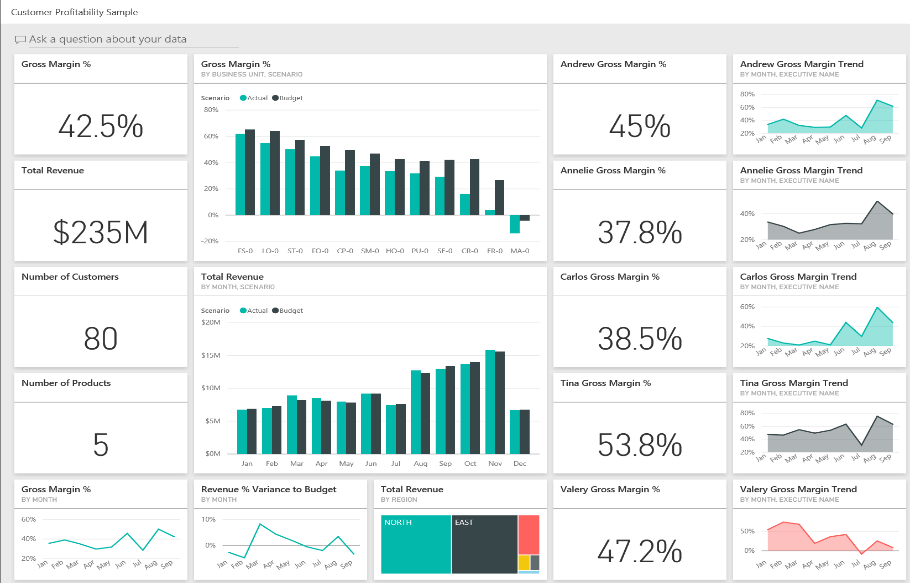
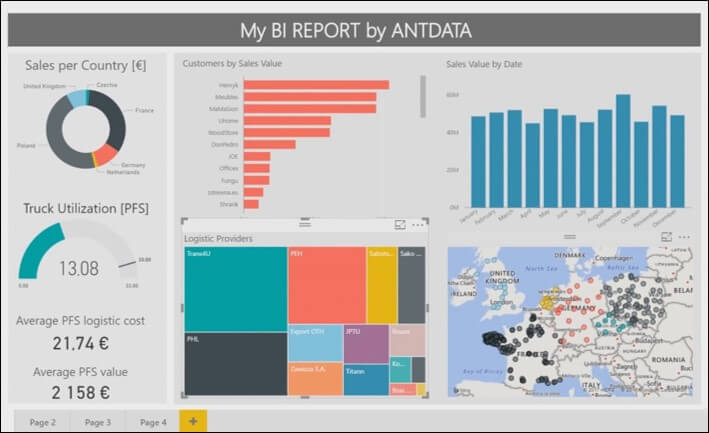
However, the main reason for its popularity is of course the visually appealing, readily accessible, interactive reports that can be easily generated! Reports that allow the viewer to filter and drilldown into the data to find what they need
MAIN STEPS TO CREATING A POWER BI DASHBOARD
The following steps provide a brief overview of the main steps that are involved in creating a report using the Power BI platform.
Step 1 – Connect Datasource(s)
Power BI lets you connect to an extensive variety of data sources. Via the Power Query Editor from within the Power BI Desktop interface you can choose to either link to or import from a selected data source. The source data might be that of an Excel file, a database, a CSV/TXT file, SAP, Salesforce etc…
Step 2 – Clean/Transform the Data
Once the data is loaded, you can now cleanse the data or shape it according to your requirements. This data transformation might include, deleting unwanted rows or columns, setting the names of column headers, changing field formats or concatenating data from different fields together.
These actions need only to be setup once! Each time the data source refreshes these steps will now be automatically repeated by Power BI.
Step 3 – Data Modelling
Data modelling is the most challenging and technical element within Power BI but it is key to the process. It is at this stage that relationships between different data sources tables are added, hierarchies created and measures/calculations formulated using the DAX query language. Getting the linking of data tables right and the formulation of measures correct, is required to ensure that end users are reporting on data correctly.
Step 4 – Data Visualisation
Now that the core data elements are all setup, users can now play around with adding visual elements to reports. Creating stunning reports by simply dragging and dropping the now setup data fields and measures into different visualisation tools/graphs.
Step 5 – Publishing /Sharing Reports
The best way to share Power BI reports to a wider audience is via the online Power BI Service. This cloud service allows for publishing of reports securely with near-real-time refresh rates to an online audience. These online reports can then be viewed via a direct hyperlink, saved within other user’s Power BI Service Interfaces, through Power BI mobile apps or they maybe embed in other webpages or connected software tools. The need for sharing large reporting files in emails or stored in corporate network drives is no more.
CONTACT OLAS’S TO FIND OUT MORE
At Olas we are big fans of Power BI and we offer introductory and advanced corporate training courses on it. Our Application Development team also provide consultancy & development services to clients to design/develop new Power BI reports or to enhance existing reports. More often than not, our clients have had some prior knowledge of Power BI, but reach out to us as our expert technical assistance is required for the creation of the initial suite of reports. With this in mind, there is always a great focus on not just delivering suites of dashboards/reports but also passing on the knowledge of their creation/setup to the final owners of the reports.
Author: Fergal O’Connor, Senior Training Consultant, Application Development Department.